File:Figure 4.21 - Spatial variability of sodium ion concentration across Antarctica.png
From ACCE
No higher resolution available.
Figure_4.21_-_Spatial_variability_of_sodium_ion_concentration_across_Antarctica.png (580 × 328 pixels, file size: 154 KB, MIME type: image/png)
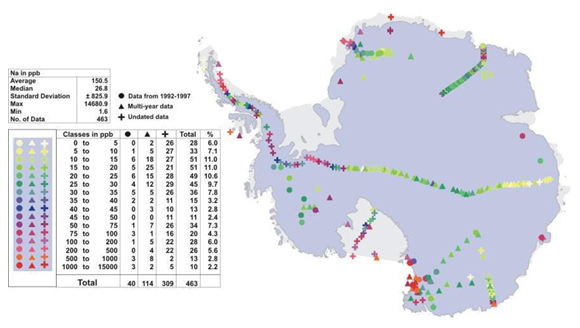
Spatial variability of Na+ concentration measured in ppb. Solid circles represent data from 1992-1997. Solid triangles represent all other multi-year data. Crosses represent non-annual or undated samples. Spatial variability of Na+ concentration ranges from 2 ppb to 14,680 ppb.
File history
Click on a date/time to view the file as it appeared at that time.
| Date/Time | Thumbnail | Dimensions | User | Comment | |
|---|---|---|---|---|---|
| current | 15:31, 6 August 2014 | | 580 × 328 (154 KB) | Maintenance script (Talk) | Uploaded by import script |
- You cannot overwrite this file.
File usage
The following page links to this file: