File:Figure 4.17 - Halley October mean total ozone and November mean 100hPa temperature by year.png
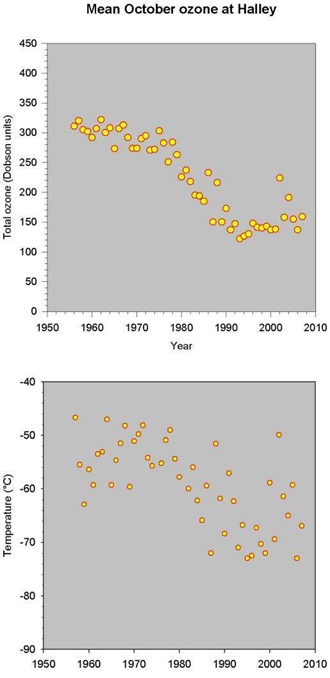
Time series of measurements at Halley (76°S) of (top) total ozone averaged over October of each year, and (bottom) temperature at 100 hPa averaged over November of each year (courtesy British Antarctic Survey). Although there is a lot of variability in the temperatures, they are now about 10°C colder than in the 1960s and 1970s, with the exception of 2002. The change in temperature is a maximum in November, later than the maximum change in ozone, because there is more sunlight later in the year, and because the thermal time constant at 100 hPa exceeds a month. The anomalous results in 2002 were the result of an anomalous early breakdown of the vortex, they are not indicators of any large reduction in the chlorine and bromine gases that cause ozone loss.
File history
Click on a date/time to view the file as it appeared at that time.
| Date/Time | Thumbnail | Dimensions | User | Comment | |
|---|---|---|---|---|---|
| current | 15:31, 6 August 2014 | | 330 × 678 (96 KB) | Maintenance script (Talk) | Uploaded by import script |
- You cannot overwrite this file.
File usage
The following page links to this file: