File:Figure 3.5 - Change in average global temperature over the last 80 million years.png
From ACCE
No higher resolution available.
Figure_3.5_-_Change_in_average_global_temperature_over_the_last_80_million_years.png (435 × 524 pixels, file size: 206 KB, MIME type: image/png)
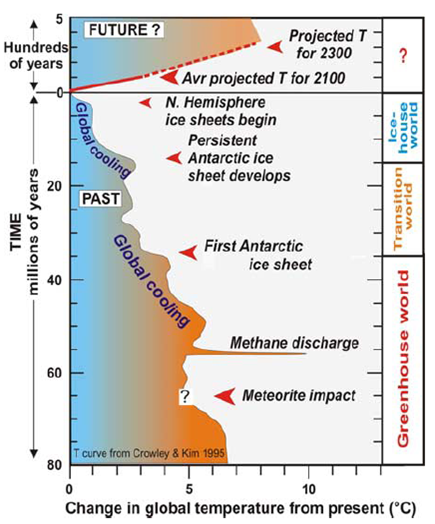
Change in average global temperature over the last 80 Ma. The temperature curve of Crowley and Kim (1995[1]) is modified to show the effect of the methane discharge at 55 Ma (Zachos et al., 2003[2]; Zachos et al., 2005[3]). The future rise in temperature expected from energy use projections shows the Earth warming back into the ‘greenhouse world’(from Mayewski et al., 2009[4]).
- ↑ Crowley, T.J. and Kim, K. 1995. Comparison of long-term greenhouse projections with the Geologic Record, Geophysical Research Letters, 22, 933-936.
- ↑ Zachos, J.C., Wara, M.W., Bohaty, S., Delaney, M.L., Petrizzo, M.R., Brill, A., Bralower, T.J. and Premoli-Silva, I. 2003. A Transient Rise in Tropical Sea Surface Temperature During the Paleocene-Eocene Thermal Maximum, Science, 302, 1551-1554.
- ↑ Zachos, J.C., Rohl, U., Schellenberg, S.A., Sluijs, A., Hodell, D.A., Kelly, D.C., Thomas, E., Nicolo, M., Raffi, I., Lourens, L.J., McCarren, H. and Kroon, D. 2005. Rapid Acidification of the Ocean During the Paleocene-Eocene Thermal Maximum, Science, 308, 1611-1615.
- ↑ Mayewski, P.A., Meredith, M.P., Summerhayes, C.P., Turner, J., Worby, A.P., Barrett, P.J., Casassa, G., Bertler, N.A.N., Bracegirdle, T.J., Naveira-Garabato, A.C., Bromwich, D.H., Campbell, H., Hamilton, G.H., Lyons, W.B., Maasch, K.A., Aoki, S., and Xiao, C. 2009. State of the Antarctic and Southern Ocean Climate System (SASOCS), Reviews of Geophysics, 47, RG1003, doi:10.1029/2007RG000231.
File history
Click on a date/time to view the file as it appeared at that time.
| Date/Time | Thumbnail | Dimensions | User | Comment | |
|---|---|---|---|---|---|
| current | 15:31, 6 August 2014 | | 435 × 524 (206 KB) | Maintenance script (Talk) | Uploaded by import script |
- You cannot overwrite this file.
File usage
The following 2 pages link to this file: