File:Figure 3.17 - Sea ice distribution at the Southern Ocean EPILOG-LGM time slice.png
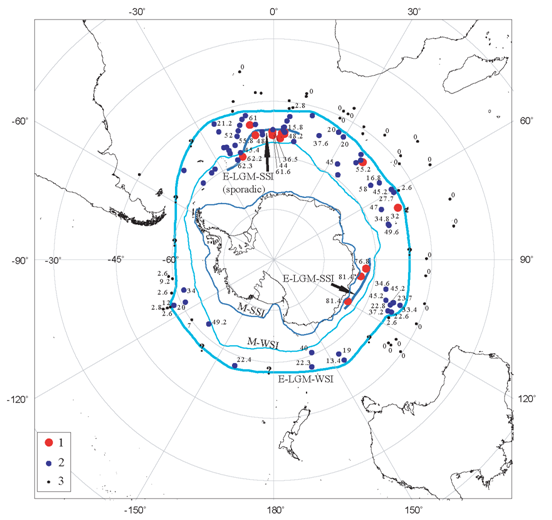
Sea ice distribution at the Southern Ocean EPILOG-LGM (E-LGM) time slice. E-LGM-winter sea ice (E-LGM-WSI) indicates maximum extent of winter sea ice (September concentration >15%). Modern winter sea ice (M-WSI) shows extent of >15% September sea ice concentration according to Comiso et al. (2003[1]). Values indicate estimated winter (September) sea ice concentration in percent derived with Modern Analog Techniques and Generalized Additive Models. Signature legend: (1) concomitant occurrence of cold-water indicator diatom F. obliquecostata (>1% of diatom assemblage) and summer sea ice (February concentration >0%) interpreted to represent sporadic occurrence of ELGM summer sea ice; (2) presence of WSI (September concentration >15%, diatom WSI indicators >1%); (3) no WSI (September concentration <15%, diatom WSI indicators <1%) (Gersonde et al., 2005[2])
- ↑ Comiso, J.C., Cavalieri, D.J. and Markus, T. 2003. Sea ice concentration, ice temperature, and snow depth using AMSR-E data, IEEE Trans Geosci Remote Sensing, 41, 243, doi:210.1109/TGRS.2002.808317.
- ↑ Gersonde, R., Crosta, X., Abelmann, A. and Armand, L. 2005. Sea-surface temperature and sea ice distribution of the Southern Ocean at the EPILOG Last Glacial Maximum-a circum-Antarctic view based on siliceous microfossil records, Quaternary Science Reviews, 24, 869-896.
File history
Click on a date/time to view the file as it appeared at that time.
| Date/Time | Thumbnail | Dimensions | User | Comment | |
|---|---|---|---|---|---|
| current | 15:31, 6 August 2014 | | 552 × 520 (145 KB) | Maintenance script (Talk) | Uploaded by import script |
- You cannot overwrite this file.
File usage
The following 2 pages link to this file: