File:Figure 3.16 - Relative sea level curve for the Ross Sea based on radiocarbon dates.png
From ACCE
No higher resolution available.
Figure_3.16_-_Relative_sea_level_curve_for_the_Ross_Sea_based_on_radiocarbon_dates.png (386 × 488 pixels, file size: 87 KB, MIME type: image/png)
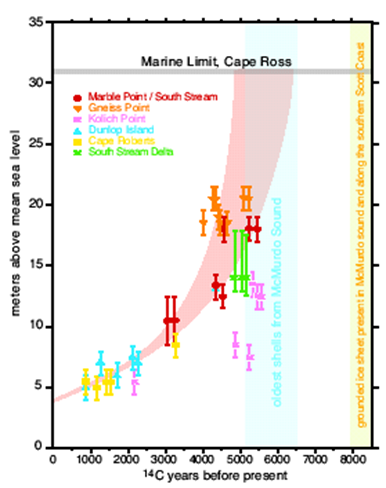
Relative sea level curve for the Ross Sea based on radiocarbon dates of elephant seal skin along with shells and penguin remains and guano, in raised beaches on the southern Scott Coast and Terra Nova Bay. This gives valuable information regarding the timing and magnitude of deglaciation (Hall et al., 2003[1]).
- ↑ Hall, B.L., Baroni, C. and Denton, G.H. 2003. Holocene relative sea-level history of the southern Victoria Land coast, Antarctica, Global and Planetary Change, 42, 241-263.
File history
Click on a date/time to view the file as it appeared at that time.
| Date/Time | Thumbnail | Dimensions | User | Comment | |
|---|---|---|---|---|---|
| current | 15:30, 6 August 2014 | | 386 × 488 (87 KB) | Maintenance script (Talk) | Uploaded by import script |
- You cannot overwrite this file.
File usage
The following 2 pages link to this file: