File:Figure 2.8 - Sodium May-July anomalies, 1300-1995.png
From ACCE
No higher resolution available.
Figure_2.8_-_Sodium_May-July_anomalies,_1300-1995.png (577 × 156 pixels, file size: 46 KB, MIME type: image/png)
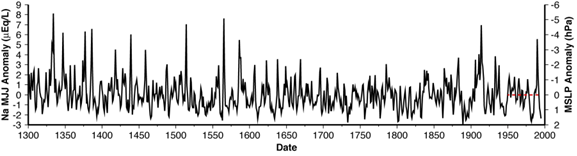
Sodium May – July time-series from 1300-1995 in Eq/L are shown as anomalies from the 1950-1995 mean (dashed line). Data are low filter. Right (inverted) axis shows equivalent MSLP anomalies for the southwest Pacific region (Campbell Is. and Macquarie Is.) using the observed calibration slope of -0.65 hPa/µEq/L derived from the instrumental period (see text). Negative (positive), states of the SAM correspond to negative (positive) MSLP anomalies at mid latitudes.
File history
Click on a date/time to view the file as it appeared at that time.
| Date/Time | Thumbnail | Dimensions | User | Comment | |
|---|---|---|---|---|---|
| current | 15:30, 6 August 2014 | 577 × 156 (46 KB) | Maintenance script (Talk) | Uploaded by import script |
- You cannot overwrite this file.
File usage
The following page links to this file: