File:Figure 2.7 - Patterns of May-July NNR MSLP anomalies for high and low DSS sea salt aerosol years.png
From ACCE
No higher resolution available.
Figure_2.7_-_Patterns_of_May-July_NNR_MSLP_anomalies_for_high_and_low_DSS_sea_salt_aerosol_years.png (570 × 221 pixels, file size: 151 KB, MIME type: image/png)
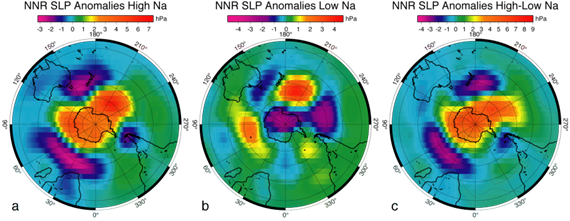
The spatial pattern of ‘early winter’ May - July NNR MSLP anomalies calculated for: a) the 6 highest (1990, 1977, 1992, 1970, 1986 and 1975) Na concentration years at DSS between 1970 to 1995; b) the 6 lowest (1982, 1981, 1995, 1985, 1993 and 1971) Na concentration years; and, c) from the difference between the 6 highest and 6 lowest Na concentration years. The difference plot accentuates the circulation changes between SAM phases in the mid-latitude trough in the southwest Indian and Pacific Ocean sectors, together with the enhanced ridging in the circumpolar trough centred on 110° E during high Na concentration years at DSS.
File history
Click on a date/time to view the file as it appeared at that time.
| Date/Time | Thumbnail | Dimensions | User | Comment | |
|---|---|---|---|---|---|
| current | 15:31, 6 August 2014 | 570 × 221 (151 KB) | Maintenance script (Talk) | Uploaded by import script |
- You cannot overwrite this file.
File usage
The following page links to this file: