File:Figure 2.29 - Residual of regression of bivalve species richness against sampling effort, from SOMBASE.png
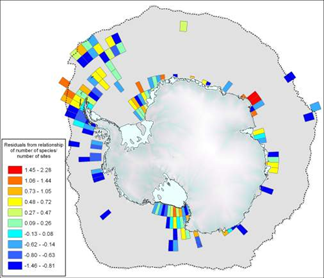
Large-scale circum-Antarctic depiction and analysis of semi-standardized biodiversity-datasets is possible for the first time using databases that contain information from various sources, historical and modern. In this example, from the SOMBASE database (Griffiths et al., 2003[1]), species richness of bivalves were plotted against sampling effort (number of sampling sites) and are shown as the residual values from this regression. Red/orange indicate species richness above the mean, green/blue values below the mean; grey areas: no representative data. This example shows the high spatial heterogeneity obviously shaped by ecological conditions and being of high relevance for predictions of climate change impact and natural conservation strategies.
- ↑ Griffiths, H.J., Linse, K. and Crame, J.A. 2003. SOMBASE – Southern Ocean Mollusc Database: a tool for biogeographic analysis in diversity and ecology, Organisms Diversity and Evolution, 3, 207-213.
File history
Click on a date/time to view the file as it appeared at that time.
| Date/Time | Thumbnail | Dimensions | User | Comment | |
|---|---|---|---|---|---|
| current | 15:31, 6 August 2014 | | 324 × 278 (97 KB) | Maintenance script (Talk) | Uploaded by import script |
- You cannot overwrite this file.
File usage
The following page links to this file: