File:Figure 2.20 - Correlation pattern of JJA MSLP anomalies and MSA variability at GF12.png
From ACCE
No higher resolution available.
Figure_2.20_-_Correlation_pattern_of_JJA_MSLP_anomalies_and_MSA_variability_at_GF12.png (366 × 276 pixels, file size: 91 KB, MIME type: image/png)
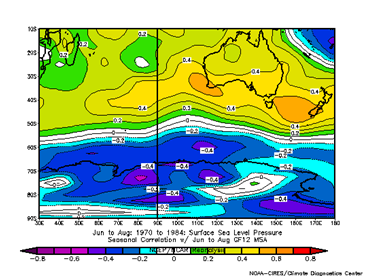
The cross correlation pattern with R values for June - August MSLP anomalies for the Indian Ocean and Southern Ocean region and MSA variability at GF12, (97° E) in Queen Mary Land. This shows the strong relationship between MSA and the SAM.
File history
Click on a date/time to view the file as it appeared at that time.
| Date/Time | Thumbnail | Dimensions | User | Comment | |
|---|---|---|---|---|---|
| current | 15:31, 6 August 2014 | | 366 × 276 (91 KB) | Maintenance script (Talk) | Uploaded by import script |
- You cannot overwrite this file.
File usage
The following page links to this file: