File:Figure 2.18 - Southern Ocean scatterometer and thermal infrared data acquired on 15 Jan 1995.png
From ACCE
No higher resolution available.
Figure_2.18_-_Southern_Ocean_scatterometer_and_thermal_infrared_data_acquired_on_15_Jan_1995.png (553 × 546 pixels, file size: 376 KB, MIME type: image/png)
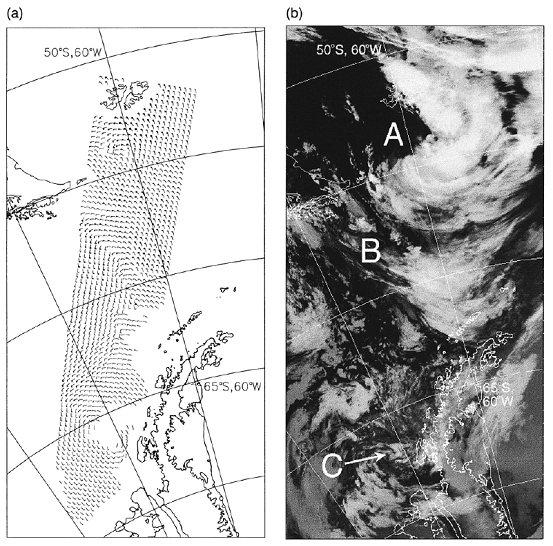
Near-coincident data over the Southern Ocean on 15 Jan 1995. (a) ERS-1 scatterometer swath acquired between 13:09 and 13:15 GMT; (b) Thermal infrared AVHRR imagery obtained at 13:11 UTC. Wind feathers point in the direction the wind is blowing; half a barb represents 2.5 m/sec, and a full barb 5.0 m/sec. Labelled features are described in the text. (Marshall and Turner, 1999[1]; courtesy of the American Meteorological Society).
- ↑ Marshall, G.J. and Turner, J. 1999. Synoptic-scale weather systems observed during the FROST project via scatterometer winds, Weather and Forecasting, 14, 867 877.
File history
Click on a date/time to view the file as it appeared at that time.
| Date/Time | Thumbnail | Dimensions | User | Comment | |
|---|---|---|---|---|---|
| current | 15:31, 6 August 2014 | | 553 × 546 (376 KB) | Maintenance script (Talk) | Uploaded by import script |
- You cannot overwrite this file.
File usage
The following page links to this file: