Ocean change over the next 100 years
- This page is part of the topic Antarctic climate and environment change over the next 100 years
Contents
Simulation of present-day conditions in the Southern Ocean.
Coupled General Circulation Models (CGCMs) used in the framework of the IPCC’s AR4 have made significant progress in their representation of high latitude processes compared to earlier model versions (Randall et al., 2007[1]). However, the Southern Ocean remains one of the regions where the largest differences are found between models and observations and between different models. In particular, the transport of the Antarctic Circumpolar Current (ACC) through Drake Passage simulated by those models ranges from –6 Sverdrup (Sv, where 1 Sverdrup = 1 × 10⁶m3/sec) (i.e. a westward transport) to more than 300 Sv (eastward transport). Only two models among the nineteen analysed by Russell et al. (2006a[2]) were able to obtain transports that were within 20% of the value estimated from observation (135 Sv), while most of the simulated values were within 50 Sv of this estimate. Those strong biases have been attributed to different factors (Russell et al., 2006b[3]). Some models tend to simulate too low a zonal wind stress in the Southern Ocean or to have a maximum in zonal wind stress that is located too far north compared to observations. As a consequence, the simulated wind stress in the latitude band of the Drake Passage is too low, resulting in a too weak ACC transport in those models (Russell et al., 2006a[2]). The density contrast across Drake Passage appears to be another important driving factor of the ACC transport in models. The errors in the simulation of this density gradient, partly due to problems in estimating the export of North Atlantic Deep Water (NADW) towards the Southern Ocean, could thus play a significant role in explaining the difference in transport between model and observations (Russell et al., 2006a[2]).
The representation of Southern Hemisphere subpolar gyres in IPCC AR4 climate Models has been investigated by Wang and Meredith (2008[4]). As shown in Chapter 1, the models reproduce three southern subpolar gyres: the Weddell Gyre, Ross Gyre, and Australian-Antarctic Gyre, in agreement with observations. Some models simulate the presence of a subpolar ‘‘supergyre’’, with strong connectivity between these three gyres. The gyre strengths and structures show a great range across the various models. The link between the gyre strengths and wind stress curls is weak, indicating that the Sverdrup balance (the theoretical relationship between the wind stress exerted on the surface of the open ocean and the vertically integrated meridional (north-south) transport of ocean water) does not hold for the modelled southern subpolar gyres; instead, the simulated gyre strengths are mainly determined by upper layer meridional density gradients, which are themselves determined predominantly by the salinity gradients. These findings suggest that a correct simulation of salinity is crucial for the simulation of Southern Ocean circulation.

When the temperature and salinity averaged over all the models is compared to observations (Figure 5.14), the zonal mean differences are relatively small. There is a tendency to have too warm and too salty water masses around 30-40°S in the depth range 500-1,000 m (Randall et al., 2007[1]). This could be related to a too far northward site of formation of Antarctic intermediate waters (AAIW) in those models. Besides, on average, in the same depth range but in the latitude band 60-70°S, the models tend to simulate too cold and too fresh water masses. This bias could be caused by a too weak inflow of warm and salty waters from the north or by excessive exchanges with the surface. Overall, the representation of the vertical stratification for the ensemble mean seems a reasonable projection, although it conceals significant over and under estimates in several of the models (Russell et al., 2006a[2]).
Projections for the Twenty First Century
There is no agreement for the projections of the ACC transports among 19 IPCC AR4 models (Wang and Meredith, 2008[4]). The ACC transports are significantly increased in eight models, while they are significantly decreased in eight other models. A recent observational study on the evolution of the ACC transport over the past several decades revealed that that there is no increase in the tilt of isopycnals. This indicates that the ACC transport is not sensitive to the significant intensification of the Southern Hemisphere westerlies during the past several decades as suggested by some models, increasing our uncertainties in the future evolution of the ACC transport (Böning et al., 2008[5]).
The Southern Hemisphere subpolar gyres over the Twenty First Century in IPCC AR4 models generally become significantly intensified (Wang and Meredith, 2008[4]). This is a consequence of the wind forcing over the subpolar region becoming more cyclonic, associated with the intensification and southward shift of the circumpolar westerlies. Conversely, changes in freshwater forcing and in the transport of the adjacent ACC exert only minor influences. The strengthening of the subpolar gyres will likely have strong impacts on the mass balance of ice shelves and the stability of the Antarctic ice sheets, and could also impact strongly on the transformations of water masses within the subpolar gyres and the exports of dense waters to lower latitudes.
The changes of ocean temperature and salinity (means over 2091-2100 minus means over 2001-2010) are presented in summer-winter pairs in Figures 5.15(i) through 5.16(vi). For the purposes of averaging, winter is taken as the time of peak sea ice (August, September, October), and summer as the sea ice minimum (February, March, April). Output from 19 models is used in the calculations (see caption to Figure 5.14). This average over the ensemble of models is likely the most reasonable estimate of the future change presently available but, because of the large scatter between the projections performed with different models, the analysis of those future changes has to be taken with caution.
The SST changes are small compared with those observed in surface air temperature in the climate models, because the heat capacity of the ocean is much larger than that of the atmosphere. Nevertheless both the atmospheric and oceanic temperatures will have an effect on sea ice. Figure 5.15(i)(a) shows that south of 60ºS in summer the SSTs are likely to be warmer than at present in 2100 by between 0.5ºC and 1.0ºC, except in the Amundsen Sea where they are likely to be warmer by 1.0 to 1.25ºC. South of 60ºS in winter (Figure 5.15(i)(b)) the SSTs are likely to be close to what they are now, i.e. between up to 0.5ºC warmer or -0.25ºC cooler than they are at present, except far offshore off Dronning Maud Land, off West Antarctica and off Queen Mary Land, where they may warm to 0.5ºC to 1.0ºC.
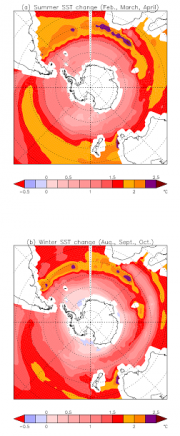
5.15(i) Sea surface temperature (SST) change for (a) summer and (b) winter between 2000 and 2100.
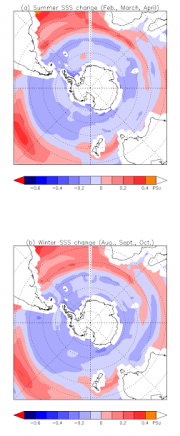
5.15(ii) Sea surface salinity (SSS) change for (a) summer and (b) winter, between 2000 and 2100.
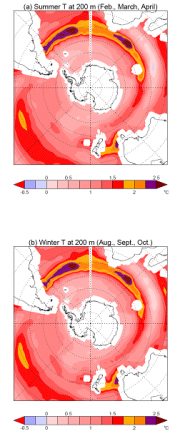
5.15(iii) Ocean temperature change at 200 m for (a) summer and (b) winter, between 2000 and 2100.
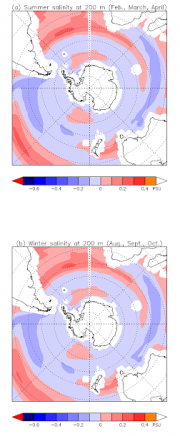
5.15(iv) Salinity change at 200 m for (a) summer and (b) winter, between 2000 and 2100.
_-_Sea_surface_temperature_change_for_summer_and_winter,_between_2000_and_2100.png)
_-_Sea_surface_salinity_change_for_summer_and_winter,_between_2000_and_2100.png)
_-_Ocean_temperature_change_at_200m_for_summer_and_winter,_between_2000_and_2100.png)
_-_Salinity_change_at_200m_for_summer_and_winter,_between_2000_and_2100.png)
Figure 5.15(ii)(a) shows that to the south of 60ºS in summer, the surface waters will be fresher by 0.1 to 0.2 units, with local patches up to 0.3 fresher in the Weddell Sea, in the Ross Sea off Oates Land, and in a few patches elsewhere along the coast. Figure 5.15(ii)(b) shows that south of 60ºS in winter the pattern is very similar, but the surface waters are fresher over a larger area and there are salinities up to 0.3 units fresher west of the Peninsula.
Figure 5.15(iii) shows that in both summer (a) and winter (b) the bottom water temperatures on the continental shelf at 200 m in 2100 are likely to be warmer by between 0.5ºC and 0.75ºC, except in the Weddell Sea where the warming is less (between 0ºC and 0.5ºC).
Figure 5.15(iv) shows that in both summer (a) and winter (b) the bottom water salinities on the continental shelf in 2100 are likely to be up to 0.1 units fresher than they are now, and up to 0.2 fresher in the Weddell Sea.
_-_Zonal_mean_cross_section_of_ocean_temperature_difference_between_2000_and_2100.png)
As shown in Figure 5.15(v), regardless of season the bottom waters from the surface down to 4,000 m along the continental margin are expected to warm in winter and summer by around 0.25ºC, with the possibility of warming by up to 0.5ºC or slightly more at depths of 200 to 500m. The warming surface layers in both winter and summer are quite thin – largely less than 200 m. There is significant warming (0.75 to almost 2ºC in all seasons) at the surface between 40 and 60ºS, in the core regions of the Antarctic Circumpolar Current. The CGCMs reproduce quite well the mid-depth warming observed during the second half of the Twentieth Century, in particular if the effect of volcanic eruptions is taken into account in models (Fyfe, 2006[6]). During the Twenty First Century, this warming is projected to continue, reaching nearly all depths when averaged over the ensemble of models. Close to the surface, the warming of the Southern Ocean during the Twenty First Century is weaker than in other regions. This is partly related to the large heat storage by the ocean, which removes a large amount of heat from the atmosphere in an area where the ocean covers nearly all the longitudes and where relatively deep mixed layers occur.
_-_Zonal_mean_cross_section_of_salinity_difference_between_2000_and_2100.png)
As shown in Figure 5.15(vi), along the continental margin, there is no major change in salinity, except above depths of around 400m, above which surface waters are fresher than at present by up to almost 0.2 at the surface between the coast and about 45ºS. The freshening is clearly very much a surface phenomenon, although the Antarctic Intermediate Water is also slightly fresher.
The vertical stratification increases in most of the models during the Twenty First Century because of the surface warming and the freshening southward of 45°S (Figure 5.15(v) and Figure 5.15(vi)). This surface salinity decrease, which has a dominant impact on the density changes at high latitude, is caused by the increase in precipitation minus evaporation at high latitude. Changes in freshwater transport by ocean currents and sea ice could also play a strong role as shown by Bitz et al. (2006[7]) in their analysis of the results of the CCSM3 model. The enhanced stratification tends to reduce vertical exchanges and is responsible for a decrease in the vertical heat transfer to the surface from the relatively warm water at depth. This effect contributes to the moderate surface temperature increase simulated in the Southern Ocean during the Twenty First Century. Changes in the stratification alter the isopycnal diffusion in models by modifying the slope of the isopycnals, resulting in a reduction of the heat transport towards the surface (e.g., Gregory, 2000[8]; Bitz et al., 2006[7]). By contrast, through the same mechanisms, the stratification increase is responsible for a warming and an increase in salinity of the Southern Ocean at mid-depth in many models.
As a result of the surface density decrease, the ocean ventilation and in particular the formation of Antarctic Bottom Water decrease in many models although the magnitude of the changes in AABW is strongly variable among the models (e.g., Manabe et al., 1991[9]; Manabe and Stouffer, 1993[10]; Hirst, 1999[11]; Bates et al., 2005[12]; Bitz et al., 2006[7]; Bryan et al., 2006[13]). This lower ventilation in response to the increase in greenhouse gas concentration in the atmosphere induces a positive feedback mechanism by reducing the heat storage in the Southern Ocean as well as reducing the uptake of carbon dioxide, more carbon remaining in the atmosphere during the Twenty First Century compared to a case with constant ventilation of the Southern Ocean (e.g., Sarmiento et al., 1998[14]; Matear and Hirst, 1999[15]).
Vertical mixing does not decrease over the Twenty First Century at all locations of the Southern Ocean in all models. Increased wind stresses could result in deeper mixed layers in some areas. The decrease in ice extent could induce stronger cooling in winter that leads to stronger mixing at the new ice edge. Shifts in convection patterns have also been noticed, with decreased mixing in some areas but increases in others (e.g., Bitz et al., 2006[7]; Conil and Menéndez, 2006[16]).
Ocean ventilation could be enhanced because of the surface divergence induced by the increase in the wind stress projected during the Twenty First Century. Russell et al. (2006b[3]) argue that this effect could be significantly underestimated in some models because of westerlies located too far north in the control climate. By comparing two model versions of the GFDL model, they show that the model version displaying a too northerly maximum of the zonal wind stress simulates much lower heat (and carbon dioxide) storage in the Southern Ocean during the next centuries than does the version with more realistic winds. In the latter simulation, the effect of the enhanced wind-driven divergence is indeed strong enough to overwhelm the influence of the increased stratification at high latitude.
Long-term evolution of the Southern Ocean
Only a few studies have addressed the evolution of the Southern Ocean on timescales longer than a century. To do so, numerical experiments have been conducted in which CO2 concentration is progressively increased during a few decades and then maintained constant over several centuries. All those numerical experiments show a strong warming of the Southern Ocean (Hirst, 1999[11]; Bi et al., 2001[17]; Goosse and Renssen, 2001[18]; Bates et al., 2005[12]; Petoukhov et al., 2005[19]) as well as a strengthening of the ACC transport through Drake Passage (Bi et al., 2002[20]; Bates et al., 2005[12]). The ocean surface temperature changes and the sea ice shrinking obtained after a few centuries are in general as high or even higher in the Southern Ocean than the ones obtained in the Arctic. Indeed, the oceanic heat storage and the reduction of the oceanic heat transport towards the surface that are responsible for a weaker response in the Southern Ocean during the Twenty First Century are less operative during the third millennium. As a consequence, on multi-century timescales, the Southern Ocean is one of the regions of the globe that experiences the largest warming in those simulations.
The long-term evolution of the Southern Ocean is also associated with changes in ocean currents. As a first step, the general decrease found in AABW formation over the Twenty First Century in many models continues during the following centuries (e.g., Bates et al., 2005[12]). This eventually leads in some simulations to a complete cessation of AABW formation (Hirst, 1999[11]; Bi et al., 2001[17]). However, in a second step, the long-term reorganisation of the Southern Ocean leads to an increase of AABW formation (Bi et al., 2001[17]; Bates et al., 2005[12]). This is due to a long term warming of the ocean at depth, which weakens the stratification and finally allows deep-water formation to start again or to be enhanced (Bi et al., 2001[17]). The disappearance of sea ice could also play a role because very strong atmosphere-ocean interactions take place in the zones close to the Antarctic coast that become ice-free even in winter, leading to new sites of deep water formation and thus an enhancement of deep water production (Bates et al., 2005[12]). It has been suggested that those long term changes in ocean circulation are associated with an increase in heat transport and play a significant role in the long-term warming simulated at high southern latitudes (e.g. Goosse and Renssen, 2001[18]). Unfortunately, although this long term shift from a decrease of AABW formation to an increase is found in nearly all the available long-term simulations, the timing of the reversal is strongly depending on the model, ranging from a few centuries at most (Goosse and Renssen, 2001[18]; Bates et al., 2005[12]) to more than a millennium (Hirst, 1999[11]; Bi et al., 2001[17]). Furthermore, the freshwater flux from the melting of the Antarctic ice sheet, which could strongly influence stratification and deep water formation in the Southern Ocean on this time-scale, is included in none of those simulations, increasing our uncertainties in the long-term evolution of the system. A recent study (Swingedouw et al., 2008[21]) using a coupled climate-ice sheet model has shown that taking into account the long-term influence of the freshwater flux from the melting of Antarctic ice sheet contributes to the formation of a cold halocline in the Southern Ocean. This limits sea ice cover retreat under global warming and reduces local surface warming compared to simulations where this effect is not taken into account.
Conclusions
Forecasts of future conditions are made using coupled models. The wide range of results obtained by state of the art models indicates that there are still significant deficiencies in the different models - mainly due to inadequate representations of relevant processes (for example through inappropriate parameterisation), or to insufficiently high resolution. To a large extent model validation occurs through model intercomparison, simply because observations are scarce, which means that arguments may be circular. Surface data from satellites are available for some parameters with sufficient coverage in time and space, but in-situ data from the ocean interior are still patchy in space and intermittent in time. In the ice-covered areas of the Southern Ocean, in-situ data are still almost exclusively collected in the context of research expeditions determined in time and space by initiatives to study processes rather than to make repeat measurements, and limited by funding cycles. Operational observations of climate relevant data are still in their infancy, even though the Argo system is a big step forward. Although excellent technologies are available, with a wide range of autonomous devices, such as moored systems, floating systems, gliders, or sensor-carrying animals, the deployment and maintenance of these technologies in a sustained manner is still out of sight.
To reach that point a Southern Ocean Observing System (SOOS) has to be established. This will require the cooperation of agencies and research institutions in coordinating the use of their resources, but it requires at the same time further development of instrumentation in order to reduce the effort needed to obtain the required measurements with the appropriate time and space resolution. The provision of climate-relevant observations from an established network will release resources from the research community that can be used for process studies in order to improve the representation of those processes in the models.
References
- ↑ 1.0 1.1 Randall, D.A., Wood, R.A., Bony, S., Colman, R., Fichefet, T., Fyfe, J., Kattsov, V., Pitman, A., Shukla, J., Srinivasan, J., Stouffer, R.J., Sumi, A. and Taylor, K.E. 2007. Climate Models and Their Evaluation. In: Climate Change 2007: The Physical Science Basis. Contribution of Working Group I to the Fourth Assessment Report of the Intergovernmental Panel on Climate Change [Solomon, S., D. Qin, M. Manning, Z. Chen, M. Marquis, K.B. Averyt, M.Tignor and H.L. Miller (eds.)]. Cambridge University Press, Cambridge, United Kingdom and New York, NY, USA.
- ↑ 2.0 2.1 2.2 2.3 Russell, J.L., Stouffer, R.J. and Dixon, K.W. 2006a. Intercomparison of the Southern Ocean circulation in IPCC coupled model controm simulations, J. Clim., 19, 4560-4575.
- ↑ 3.0 3.1 Russell, J.L., Dixon, K.W., Gnanadesikan, A., Stouffer, R.J. and Toggweiler, J.R. 2006b. The Southern hemisphere westerlies in a warming world: propping open the door to the deep ocean, J. Clim., 19, 6382-6390.
- ↑ 4.0 4.1 4.2 Wang, Z. and Meredith, M.P. 2008. Density-driven Southern Hemisphere subpolar gyres in coupled climate models, Geophysical Research Letters, 35(14) 5, pp. 10.1029/2008GL034344.
- ↑ Böning, C. W., A. Dispert, M. Visbeck, S. R. Rintoul, and F. Schwarzkopf, 2008. Observed multi-decadal ocean warming and density trends across the Antarctic Circumpolar Current, Submitted.
- ↑ Fyfe, J.C. 2006. Southern Ocean warming due to human influence, Geophys. Res. Let., 33, L19701, doi:10.1029/2006GL027247 .
- ↑ 7.0 7.1 7.2 7.3 Bitz, C.M., Gent, P.R., Woodgate, R.A., Holland, M.M. and Lindsay, R. 2006. The influence of sea ice on ocean heat uptake in response to increasing CO2, J. Clim., 19, 2437-2450.
- ↑ Gregory, J.M., 2000. Vertical heat transport in the ocean and their effect on time-dependent climate change, Clim. Dyn., 16, 501-515.
- ↑ Manabe S., Stouffer, R.J., Spelman, M.J. and Bryan, K. 1991. Transient responses of a coupled atmosphere-ocean model to gradual changes of atmospheric CO2. I. Annual mean response, J. Clim., 4, 785-818.
- ↑ Manabe, S. and Stouffer, R.J. 1993. Century-scale effects of increased atmospheric CO2 on the ocean-atmosphere system, Nature, 364, 215-218.
- ↑ 11.0 11.1 11.2 11.3 Hirst, A.C. 1999. The Southern Ocean response to a global warming in the CSIRO coupled ocean-atmosphere model, Environmental Modeling and Software, 227-241.
- ↑ 12.0 12.1 12.2 12.3 12.4 12.5 12.6 Bates, M.L., England, M.H. and Sijp, W.P. 2005. On the multi-century Southern Hemisphere response to changes in atmospheric CO2-concentration in a global climate model, Meteorol. Atmos. Phys., 89, 17-36.
- ↑ Bryan F.O., Danabasoglu, G., Gent, P.R. and Lindsay, K. 2006. Changes in ocean ventilation during the 21st century in the CCSM3, Ocean Model., 15, 141-156.
- ↑ Sarmiento, J.L., Hughes, T.M.C., Stouffer, R.J. and Manabe, S. 1998. Simulated response of the ocean carbon cycle to an anthropogenic climate warming, Nature, 393, 245-249.
- ↑ Matear, R.J. and Hirst, A.C. 1999. Climate change feedback on the future oceanic CO2 uptake, Tellus, 51B, 722-733.
- ↑ Conil, S. and Menéndez, C.G. 2006. Climate fluctuations of the Weddell Sea and its surroundings in a transient climate change scenario, Clim. Dyn., 27 (1), 83-99.
- ↑ 17.0 17.1 17.2 17.3 17.4 Bi, D.H., Budd, W.F., Hirst, A.C. and Wu, X.R. 2001. Collapse and reorganisation of the Southern Ocean overturning under global warming in a coupled model, Geophys. Res. Let., 28 (20), 3927-3930.
- ↑ 18.0 18.1 18.2 Goosse, H. and Renssen, H. 2001. A two-phase response of Southern Ocean to an increase in greenhouse gas concentrations, Geophysical Research Letters, 28, 3469-3473.
- ↑ Petoukhov, V., Claussen, M., Berger, A., Crucifix, M. Eby, M., Eliseev, A., Fichefet, T., Ganopolski, A., Goosse, H., Kamenkovich, I. Mokhov, I., Montoya, M., Mysak, L.A., Sokolov, A., Stone, P., Wang, Z. and Weaver, A.J. 2005. EMIC Inter-comparison Project (EMIP-CO2): Comparative analysis of EMIC simulations of climate, and of equilibrium and transient responses to atmospheric CO2 doubling, Climate Dynamics, 25, 363-385.
- ↑ Bi, D., Budd, W.F., Hirst, A.C. and Wu, X. 2002. Response of the Antarctic circumpolar current transport to global warming in a coupled model, Geophys. Res. Lett., 29 (24), 2173, doi:10.1029/2002GL015919.
- ↑ Swingedouw D., Fichefet, T., Huybrechts, P., Goosse, H., Driesschaert, E. and Loutre, M.F. 2008. Antarctic ice-sheet melting provides negative feedbacks on future climate warming, Geophysical Research Letters, 35, L17705, doi:10.1029/2008GL034410.