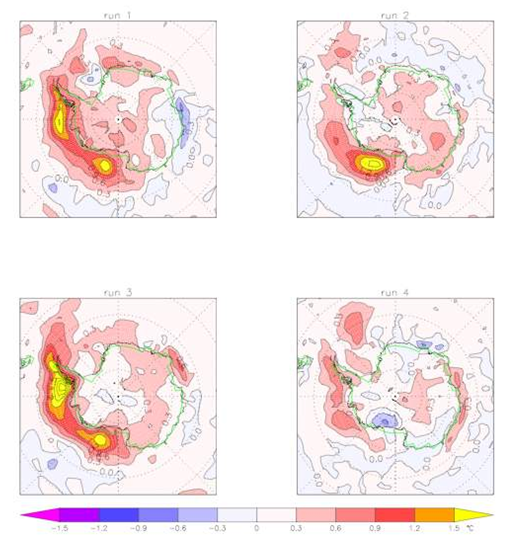
File:Figure 5.3 - Surface temperature trends for 1960-2000 for winter (JJA) for the MPI ECHAM5 model.png
From ACCE
Revision as of 14:30, 6 August 2014 by Maintenance script (Talk)
Figure_5.3_-_Surface_temperature_trends_for_1960-2000_for_winter_(JJA)_for_the_MPI_ECHAM5_model.png (512 × 535 pixels, file size: 340 KB, MIME type: image/png)
Surface temperature trends in oC/decade from 1960–2000 for winter (JJA) for the MPI ECHAM5 model. The four different runs all follow the IPCC climate of the Twentieth Century (20C3M) experiment and use the same anthropogenic forcings.
File history
Click on a date/time to view the file as it appeared at that time.
| Date/Time | Thumbnail | Dimensions | User | Comment | |
|---|---|---|---|---|---|
| current | 14:30, 6 August 2014 |  | 512 × 535 (340 KB) | Maintenance script (Talk) | Uploaded by import script |
- You cannot overwrite this file.
File usage
The following page links to this file:
