File:Figure 4.1 - Austral summer gridded 500hPa geopotential height monthly anomalies for 1989-2008.png
From ACCE
Revision as of 14:30, 6 August 2014 by Maintenance script (Talk)
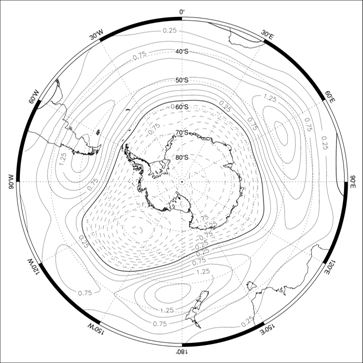
Figure_4.1_-_Austral_summer_gridded_500hPa_geopotential_height_monthly_anomalies_for_1989-2008.png (363 × 363 pixels, file size: 106 KB, MIME type: image/png)
The austral summer SAM derived from gridded 500 hPa geopotential height monthly anomaly data (the 500 hPa surface is approximately at an elevation of 5 km above mean sea level) for 1989-2008. Here the SAM is in its positive phase with negative anomalies over the Antarctic and positive anomalies over the Southern Ocean.
File history
Click on a date/time to view the file as it appeared at that time.
| Date/Time | Thumbnail | Dimensions | User | Comment | |
|---|---|---|---|---|---|
| current | 14:30, 6 August 2014 |  | 363 × 363 (106 KB) | Maintenance script (Talk) | Uploaded by import script |
- You cannot overwrite this file.
File usage
The following page links to this file:
