File:Figure 4.22 - Schematic illustrating the formation areas and pathways of Antarctic Bottom Water.png
From ACCE
Revision as of 14:31, 6 August 2014 by Maintenance script (Talk)
Figure_4.22_-_Schematic_illustrating_the_formation_areas_and_pathways_of_Antarctic_Bottom_Water.png (497 × 460 pixels, file size: 233 KB, MIME type: image/png)
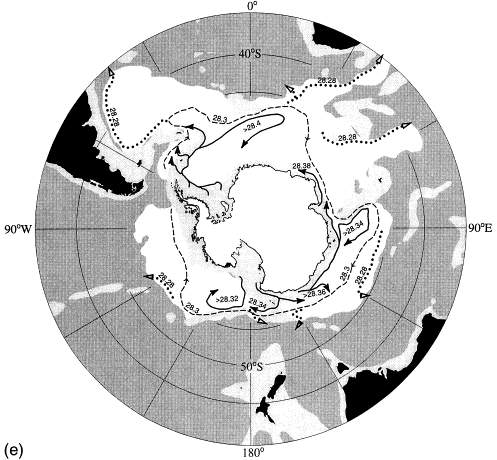
Schematic presentation of the formation areas and pathways of Antarctic Bottom Water as evidenced by water mass properties, in particular the concentration of the anthropogenic tracer CFC. It is injected into the ocean at the surface and indicates, by concentration maxima, recently ventilated water sinking to the sea bottom and spreading there from the formation areas for different densities here displayed as neutral density where the most dense water with neutral density > 28.4 kg/m3 is found in the Weddell Sea (Orsi et al., 1999[1]).
- ↑ Orsi, A.H., Johnson, G.C. and Bullister, J.B. 1999. Circulation, mixing and production of Antarctic Bottom Water, Prog. Oceanog., 43, 55-109.
File history
Click on a date/time to view the file as it appeared at that time.
| Date/Time | Thumbnail | Dimensions | User | Comment | |
|---|---|---|---|---|---|
| current | 14:31, 6 August 2014 |  | 497 × 460 (233 KB) | Maintenance script (Talk) | Uploaded by import script |
- You cannot overwrite this file.
File usage
The following page links to this file:
