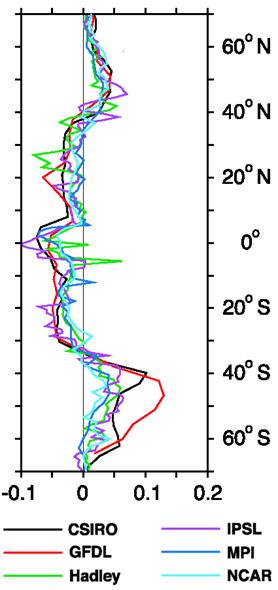
File:Figure 5.23 - Primary productivity changes for 2040-2060 in six coupled climate carbon models.png
From ACCE
Revision as of 14:31, 6 August 2014 by Maintenance script (Talk)
Figure_5.23_-_Primary_productivity_changes_for_2040-2060_in_six_coupled_climate_carbon_models.png (278 × 590 pixels, file size: 57 KB, MIME type: image/png)
Primary Productivity (PP) changes PgC/degree calculated for the period averaged 2040-2060 using six different coupled climate carbon models (Sarmiento et al., 2004b[1]). PP changes were calculated using Behrenfield and Falkowski (1997[2]), and changes were assessed against control simulations that excluded global warming.
- ↑ Sarmiento, J.L., Slater, R., Barber, R.T., Bopp, L., Doney, S.C., Hirst, A.C., Kleypas, J., Matear, R.J., Miklolajewicz, U., Monfray, P., Soldatov, V., Spall, S.A. and Stouffer, R., 2004b. Response of Ocean Ecosystems to Climate Warming, Global Biogeochemical Cycles, 18, doi:10.1029/2003GB002134.
- ↑ Behrenfield, M.J. and Falkowski, P.G. 1997. A consumers guide to phytoplankton primary production models, Limnol. Oceanogr., 47, 1479-1491.
File history
Click on a date/time to view the file as it appeared at that time.
| Date/Time | Thumbnail | Dimensions | User | Comment | |
|---|---|---|---|---|---|
| current | 14:31, 6 August 2014 |  | 278 × 590 (57 KB) | Maintenance script (Talk) | Uploaded by import script |
- You cannot overwrite this file.
File usage
The following page links to this file:
